Confessions of a Quant-Loving Value Investor
Recently we had a very interesting conversation with a particularly sophisticated family office about how we look at sizing and risk. The topic of covariance came up:
"So you look at the historical covariances, right? That’s the best guide."
Now here’s the thing about covariance, it’s an "acquired taste" if you may. The Quants love it, and we admire it, but don’t use it the way they do. Let me explain.
The story really begins with a coin flip.
Imagine someone offers you a fair coin, 50/50, but pays you 10-to-1 if you call it right. You should bet, and bet heavily, because over enough flips you would expect to come out well ahead. There’s no realistic universe where you flip a thousand times and get a thousand tails. This is the intuition behind the Kelly criterion, made famous by Ed Thorp (A Man for All Markets). Thorp used a version of it to beat blackjack and later applied related thinking to markets. The idea is beautifully simple: if you can measure the odds against the payoff better than the person offering the bet, and you get to play repeatedly, sizing your bets accordingly tends to compound well over time.
For a single bet, this is clean. Each blackjack hand is more or less independent. The Kelly formula just asks: what are the odds, what’s the payoff, how much do I wager?
I’m sure if it’s that easy, everyone would be a self-proclaimed portfolio manager. But. A portfolio isn’t a single bet. A portfolio is a collection of bets that move together, through time, in relation to one another. And that’s where the question about the covariance comes in.
The 2 Cs - and how they differ
Correlation is the direction of travel: do two things tend to move the same way, or opposite ways? Covariance is the direction and the scale: not just whether they move together, multiplied by how big each one's swings are.
I like to use an example that our CIO, Shaun Heelan, likes to refer to. Take two carmakers, Company A and Company B. Similar businesses, similar returns. But say Company A carries far more debt on its balance sheet. The enterprise values of both might wobble by the same 1%, but because Company A's equity sits on top of a much larger pile of debt, that same 1% swing in the business translates into a far bigger swing in Company A's equity.
"The equity is, in effect, a call option on the value of the whole enterprise: the more leverage, the more sensitive the option."
So, two near-identical car companies can have a correlation close to 100%, yet quite different covariance. One can move several times for every one move of the other.
Quants look at that number closely: feed in your expected returns and the covariances between every pair of positions, run the optimisation, and out comes the "optimal" set of weights: the mathematically ideal path to the best modelled outcome.
It's genuinely elegant. It's like an option-pricing model for your ENTIRE book. How awesome is THAT?
Why Quant Funds Live and Die by It
Many quant funds, with the most celebrated examples in the category, use some version of this. And for them, it's the right tool.
Why? Because they have data.
They tend to trade at extraordinarily high frequency, holding positions for seconds or minutes, often flattening the book by the end of the day. Think about how many seconds there are in a trading day: tens of thousands of seconds. Over twenty years, that's an enormous number of data points. With that much repeatable, roughly normally distributed data, the historical covariances can be genuinely informative, such as they can see how things move together, recalibrate constantly, watch signals strengthen and fade, and clean the data overnight. But, they're not really analysing businesses at all (which is what value investors ultimately like to do) but reading price action: who hit the bid, who lifted the offer, what word appeared in an earnings release and how the market has historically twitched in response.
No judgement, no thesis, and also, no biases (cognitive otherwise). Just an algorithm following the action, in and out within the hour.
We, value investors, look at the underlying business, analyze the financial data (to death sometimes), while reading the footnotes (obsessively, may I add). Often times, the historical prices are almost irrelevant: business change, management change, and hence, capital allocation changes too. THAT is one of the biggest differentiators between what they do vs. what we do.
However, I must admit that I've always been intrigued by the quant world. Their method, especially to a non-quant background person, is a brilliant, sexy thing. Truly. I admire it. (We're just not built for it.)
And before any quant reaches for the comment button: yes, I know the good ones don't just throw raw trailing covariance into an optimiser and walk away. They shrink it, they layer in factor models, they pull forward-looking volatility straight out of the options market. The sophisticated version is genuinely impressive. I'm not here (nor qualified, to be completely blunt) to argue with the maths, only to point out what even the best of it can, and cannot, see.
But... Could You Run This in European SMID?
In principle, yes, and I'm sure it has been explored by some extensively. The theoretical pros are real:
The space is structurally inefficient. The SMID cap universe is far less researched than large-caps, and a relative lack of analyst coverage is widely associated with mispricing, where shares can diverge from fair value.
Imagine a system where you can scan thousands of names a human team could never cover, take out the obvious mismatch, and pursue factor premia (quality, value, momentum) at scale without getting emotionally attached to any single story (as someone who likes to explore the psychology of investing, I personally LOVED this part)!
There are real constraints, of course, liquidity is the one-way door, easy to enter and hard to exit, but the deeper difference is what we're actually betting on: that the next three-to-five years differ from the past three-to-five. We're buying a business precisely because we think it's at an inflection point.
The difference isn't that we've found a way to make a small sample large. Instead, we use the lack of sample as a reason to pivot: when you cannot lean on frequency, you're forced back onto understanding the foundational, the actual drivers of a business. And that's exactly the kind of work we're built to do, with Shaun's structured-product discipline of reading the footnotes first, not last.
So the signal here often isn't in the ticks. What re-rates an overlooked Nordic or DACH SMID-cap is frequently not in the price action at all.
It can be a customer-churn inflection, a change of control (and hence, capital allocation), a misunderstood balance sheet, a catalyst (Yes, I'm looking at you, change of regulations) that the tape cannot see because it hasn't happened yet.
And this is the heart of it: no estimator, however clever, shrunk, factor-adjusted or implied-from-options, can price an event that has not yet occurred. There is no data for the thing that hasn't happened. That's not a flaw the quants can engineer away; it's the boundary of the whole approach.
So: a quant model can be a very useful screen in this universe, more of a way to surface candidates. But as a risk and sizing engine for a concentrated, multi-year SMID book? We believe it's the wrong instrument for that particular job.
And why is that?
Picture this: A business has fallen heavily over several years, while the broad market over the same stretch has been flat to modestly higher. So, what would a historical covariance calculation tell you? That this thing looks strongly negatively correlated to the market. A natural hedge. The model would tend to size it small and rank it low.
But that backward-looking picture is built entirely on a period in which something went badly wrong. If the business then stabilises and recovers, the relationship the model "learned" simply inverts. So which number was ever true: the backward-looking one, or the forward reality?
Shaun opines:
"For the historical covariance to guide you well, you have to be right about the future resembling the past."
Now, a fair challenge: isn't our forward view also just a guess about the future, only without the error bars? Partly, yes. But there's a difference between extrapolating a number you cannot interrogate and forming a view you can pressure-test, on the customers, the balance sheet, the owners, the catalyst, and be specifically wrong about. We'd rather be wrong about something we can examine than right-by-accident about something we can only measure in hindsight.
And the cruel irony of value investing is that we are almost always looking at a business precisely because something difficult has recently happened to it.
Its recent history can look poor. By definition, the backward-looking statistics may tell you to make it small, at the very moment the fundamentals may be about to inflect.
A well-known illustration: consider how Apple looked on the numbers in the mid-1990s versus how the business developed in the years that followed. The same backward-looking statistics that looked discouraging at one point told you very little about what came next. (This is a general teaching example about the limits of historical data, not a prediction about any company. And the honest caveat: for every Apple there's a company that looked just as cheap and simply kept falling. The point isn't that beaten-down equals opportunity, it's that the statistics alone can't tell the two apart. That's the job.)
Why Value Investing Fits This Market So Well
The irony is that the very features that make European SMID awkward for a quant risk model are, in our view, what make it fertile ground for fundamental value investing.
Start with the mispricing. A large share of SMID cap names is followed by only a few analysts, and a meaningful number by none at all. Sparse coverage means there is often no clear market consensus on the value of a change, a new product line, a new market, a cost programme, that may turn out to be a genuine catalyst.
"When a business is simply not being watched, price and value can drift apart and stay apart for some time. Capturing that doesn't require a faster computer; it requires doing the work others aren't bothering to do and then having the patience to wait."
Then there are the special situations (again, my favorite): the part of this market we find genuinely interesting.
In the under-covered corners, you don't only find cheap stocks; you find events. Take-privates. Misunderstood spin-offs. Forced sellers. Complex balance sheets that scare off the screens. These are situations where the outcome depends less on the market re-rating a multiple and more on something concrete happening, and where deep, idiosyncratic work tends to be the edge that matters.
Btw, this isn’t theoretical for us. Shaun Heelan was part of the team behind the take-private of a Swedish education business then listed on Nasdaq Stockholm, and joined the board after it went private. That is the spirit of a special situation: Not waiting for the crowd to notice a cheap stock, but engaging directly with the path to value, all the way into the boardroom.
A purely backward-looking optimiser tends to be most cautious on a business precisely when the fundamental picture may be turning. The thing that often matters most, an operational inflection, a change in ownership, a balance-sheet detail, isn't visible in the price history at all.
"The signal isn't always in the ticks. Often it's in the business (and footnotes)."
And Where We Can Be Wrong
Btw, our way of being wrong has a name too. The value trap, the business that was cheap for a reason and stays cheap. The catalyst that we were sure about and that never arrives or arrives years late. And not to mention the (in)famous path risk. And, last but not least, that one-way liquidity door, which protects us on entry and can trap us on exit if a thesis breaks in size.
We don't have a formula that makes those risks disappear. What we have is a process built around the honest expectation that some of our forward views will be wrong, and a refusal to let any single one be sized as though it can't be.
What We Actually Do
So, back to the question originally posed to us by the intelligent family office: do we run a purely Kelly-optimised book that trusts historical covariance?
No. But let me be precise, because it would be too easy to say "we don't use covariance" and leave it there.
It's not that we do not use covariance because of what it is, it's that we cannot let a backward-looking estimate set the size of a position (I recently wrote about this here). The measure is sensitive, the inputs are noisy, and we are honest enough to know we cannot estimate them with precision. So we use ranking frameworks of this kind as a discipline, a way to force the argument, not as an oracle that hands us the answer.
Because what they do well is force the right conversation. And the conversations that we believe most shape a portfolio's outcome are these two: What is the prospective return on each individual position, and how might they move with one another over the next several years, and what would drive that?
Engage seriously with those questions, looking forward, and you are at least focused on what matters.
That's not a figure you can pull off a screen. It's a judgement.
Because at the end of the day, while we're evaluating a company's capital allocation process, we're constantly thinking about ours as well. The businesses we back live or die on how management allocates capital: reinvest or fritter it away on a pricey acquisition. By the same token, we live or die on how we allocate ours: which names, how big.
Two levels, same discipline.
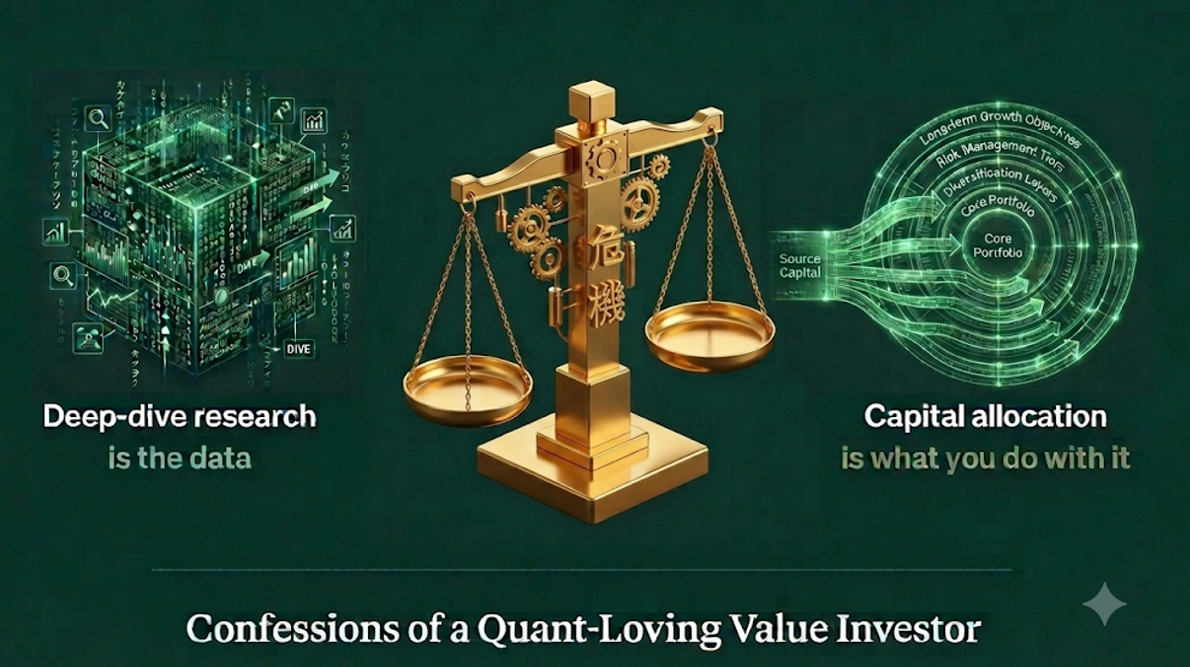
It's true... deep-dive research is the data; capital allocation is what you do with it.
-Jenny Ngan , Head of Business Development
This post is provided for general information and educational purposes only. It reflects the personal views of the author and does not necessarily represent the views of MAAT Investment Group. It is not investment advice, nor an offer, solicitation, or recommendation to buy or sell any security or to invest in any fund or strategy. Any companies or transactions mentioned are referenced solely to illustrate a general point and are not recommendations. Past performance is not a reliable indicator of future results, and the value of investments can fall as well as rise. Capital is at risk. Please seek advice from a suitably qualified professional before making any investment decision.